
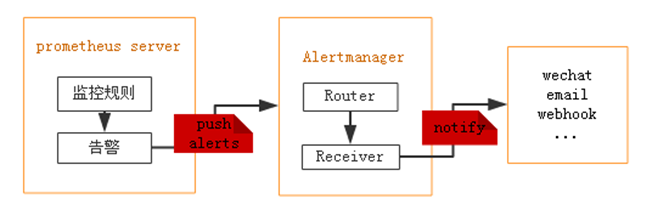
Prometheus本身不支持告警功能,主要通过插件alertmanage来实现告警。AlertManager用于接收Prometheus发送的告警并对于告警进行一系列的处理后发送给指定的用户。
Prometheus触发一条告警的过程:
prometheus--->触发阈值--->超出持续时间--->alertmanager--->分组|抑制|静默--->媒体类型--->邮件|钉钉|微信等。
安装Alertmanager
1、下载Alertmanager
[root@localhost ~]# wget https://github.com/prometheus/alertmanager/releases/download/v0.20.0/alertmanager-0.20.0.linux-amd64.tar.gz
[root@localhost ~]# tar xf alertmanager-0.20.0.linux-amd64.tar.gz
[root@localhost ~]# mv alertmanager-0.20.0.linux-amd64 /usr/local/alertmanager
2、创建启动文件
[root@localhost ~]# vim /usr/lib/systemd/system/alertmanager.service
[Unit]
Description=alertmanager
Documentation=https://github.com/prometheus/alertmanager
After=network.target
[Service]
Type=simple
User=root
ExecStart=/usr/local/alertmanager/alertmanager --config.file=/usr/local/alertmanager/alertmanager.yml
Restart=on-failure
[Install]
WantedBy=multi-user.target
3、配置alertmanager.yml文件
Alertmanager 安装目录下默认有 alertmanager.yml 配置文件,可以创建新的配置文件,在启动时指定即可。
[root@localhost ~]# cd /usr/local/alertmanager
[root@localhost alertmanager]# vim alertmanager.yml
global:
  resolve_timeout: 5m
  # 邮件SMTP配置
  smtp_smarthost: 'smtp.exmail.qq.com:25'
  smtp_from: 'service@yangxingzhen.com'
  smtp_auth_username: 'service@yangxingzhen.com'
  smtp_auth_password: '123456'
  smtp_require_tls: false
# 自定义通知模板
templates:
  - '/usr/local/prometheus/alertmanager/template/email.tmpl'
# route用来设置报警的分发策略
route:
  # 采用哪个标签来作为分组依据
  group_by: ['alertname']
  # 组告警等待时间。也就是告警产生后等待10s,如果有同组告警一起发出
  group_wait: 10s
  # 两组告警的间隔时间
  group_interval: 10s
  # 重复告警的间隔时间,减少相同邮件的发送频率
  repeat_interval: 1h
  # 设置默认接收人
  receiver: 'email'
  routes:   # 可以指定哪些组接手哪些消息
  - receiver: 'email'
    continue: true
    group_wait: 10s
receivers:
- name: 'email'
  email_configs:
  - to: 'xingzhen.yang@yangxingzhen.com'
    html: '{{ template "email.to.html" . }}'
    headers: { Subject: "Prometheus [Warning] 报警邮件" }
    send_resolved: true
- smtp_smarthost:是用于发送邮件的邮箱的 SMTP 服务器地址+端口;
- smtp_auth_password:是发送邮箱的授权码而不是登录密码;
- smtp_require_tls:不设置的话默认为 true,当为 true 时会有 starttls 错误,为了简单这里设置为 false;
- templates:指出邮件的模板路径;
- receivers 下html指出邮件内容模板名,这里模板名为“to.html”,在模板路径中的某个文件中定义。
- headers:为邮件标题;
4、配置告警模板
[root@localhost alertmanager]# mkdir -p /usr/local/prometheus/alertmanager/template
[root@localhost alertmanager]# vim /usr/local/prometheus/alertmanager/template/email.tmpl
{{ define "email.to.html" }}
{{- if gt (len .Alerts.Firing) 0 -}}
{{ range .Alerts }}
=========start==========<br>
告警程序: prometheus_alert <br>
告警级别: {{ .Labels.severity }} <br>
告警类型: {{ .Labels.alertname }} <br>
告警主机: {{ .Labels.instance }} <br>
告警主题: {{ .Annotations.summary }}  <br>
告警详情: {{ .Annotations.description }} <br>
触发时间: {{ .StartsAt.Format "2006-01-02 15:04:05" }} <br>
=========end==========<br>
{{ end }}{{ end -}}

{{- if gt (len .Alerts.Resolved) 0 -}}
{{ range .Alerts }}
=========start==========<br>
告警程序: prometheus_alert <br>
告警级别: {{ .Labels.severity }} <br>
告警类型: {{ .Labels.alertname }} <br>
告警主机: {{ .Labels.instance }} <br>
告警主题: {{ .Annotations.summary }} <br>
告警详情: {{ .Annotations.description }} <br>
触发时间: {{ .StartsAt.Format "2006-01-02 15:04:05" }} <br>
恢复时间: {{ .EndsAt.Format "2006-01-02 15:04:05" }} <br>
=========end==========<br>
{{ end }}{{ end -}}

{{- end }}
5、配置告警规则
[root@localhost alertmanager]# mkdir -p /usr/local/prometheus/rules
[root@localhost alertmanager]# cd /usr/local/prometheus/rules
[root@localhost rules]# vim node.yml
groups:
- name: Node_exporter Down
  rules:
  - alert: Node实例已宕机
    expr: up == 0
    for: 10s
    labels:
      user: root
      severity: Warning
    annotations:
      summary: "{{ $labels.job }}"
      address: "{{ $labels.instance }}"
      description: "Node_exporter 客户端在1分钟内连接失败."
在Prometheus.yml 中指定 node.yml 的路径
[root@localhost rules]# vim /usr/local/prometheus/prometheus.yml
global:
  scrape_interval:     15s # Set the scrape interval to every 15 seconds. Default is every 1 minute.
  evaluation_interval: 15s # Evaluate rules every 15 seconds. The default is every 1 minute.
  # scrape_timeout is set to the global default (10s).

# Alertmanager configuration
alerting:
  alertmanagers:
  - static_configs:
    - targets: ['localhost:9093']
      # - localhost:9093

# Load rules once and periodically evaluate them according to the global 'evaluation_interval'.
rule_files:
  - 'rules/*.yml'
  # - "first_rules.yml"
  # - "second_rules.yml"

# A scrape configuration containing exactly one endpoint to scrape:
# Here it's Prometheus itself.
scrape_configs:
  # The job name is added as a label `job=<job_name>` to any timeseries scraped from this config.
  - job_name: 'prometheus'
    # metrics_path defaults to '/metrics'
    # scheme defaults to 'http'.

    static_configs:
    - targets: ['localhost:9100']
6、重启 Prometheus 服务
[root@localhost rules]# systemctl restart prometheus
7、启动 Alertmanager
[root@localhost rules]# systemctl daemon-reload
[root@localhost rules]# systemctl start alertmanager
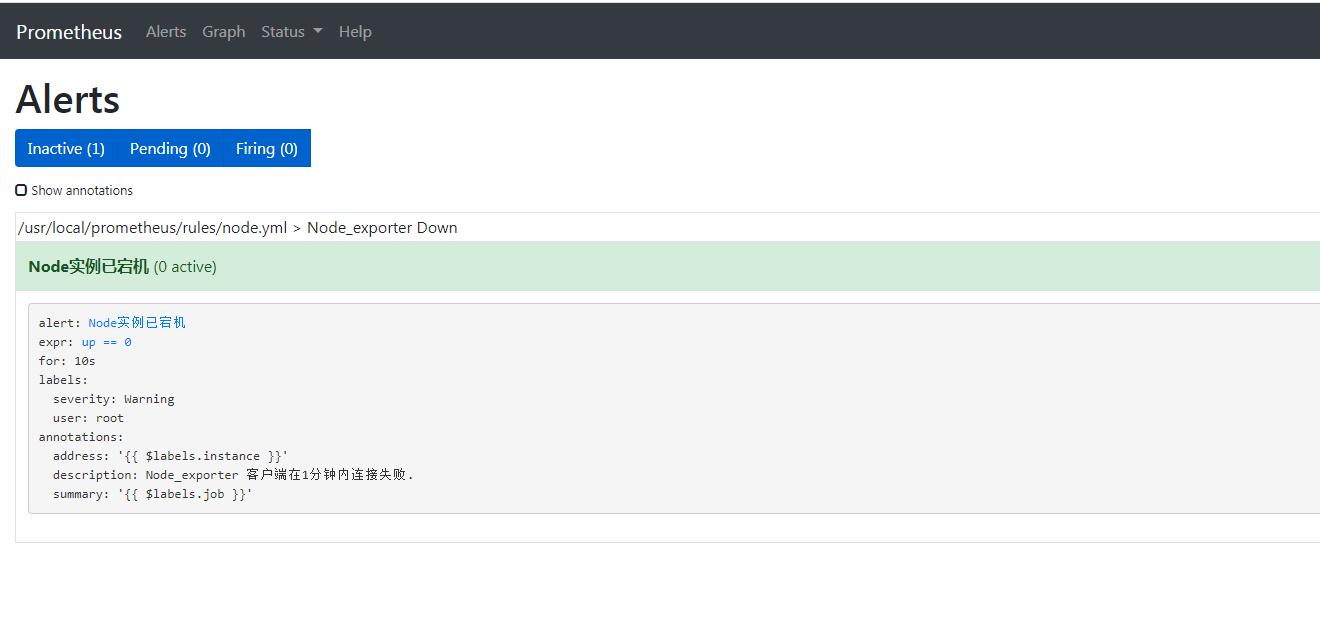
8、验证效果
此时访问prometheus管理界面可以看到如下信息:
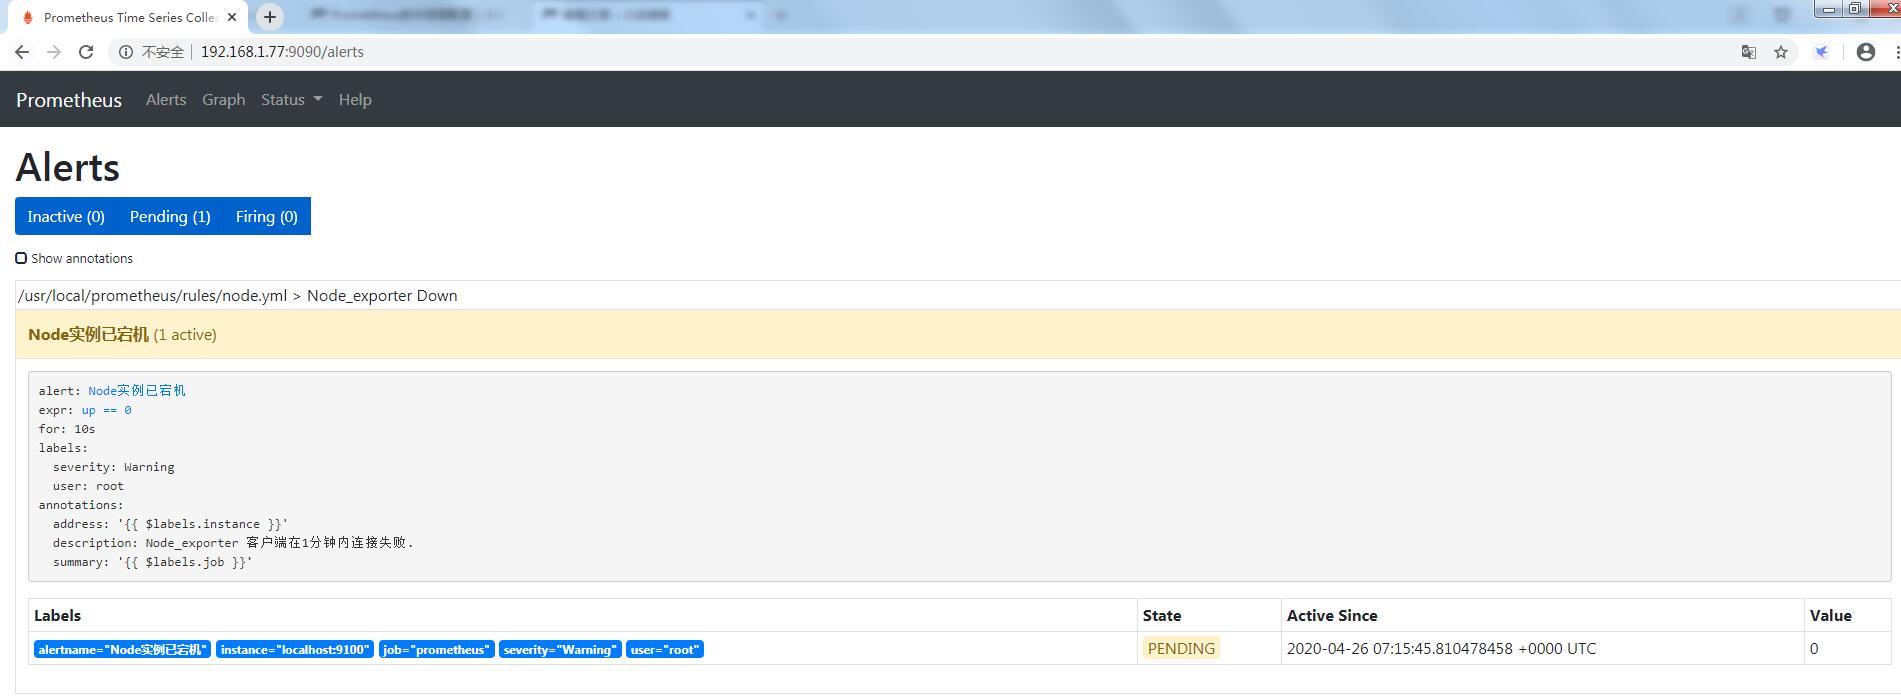
9、停止 node_exporter 服务,然后再看效果。
[root@localhost rules]# systemctl stop node_exporter
prometheus界面的alert可以看到告警状态。
- 绿色表示正常。
- 红色状态为PENDING表示alerts还没有发送至Alertmanager,因为rules里面配置了for: 10s。
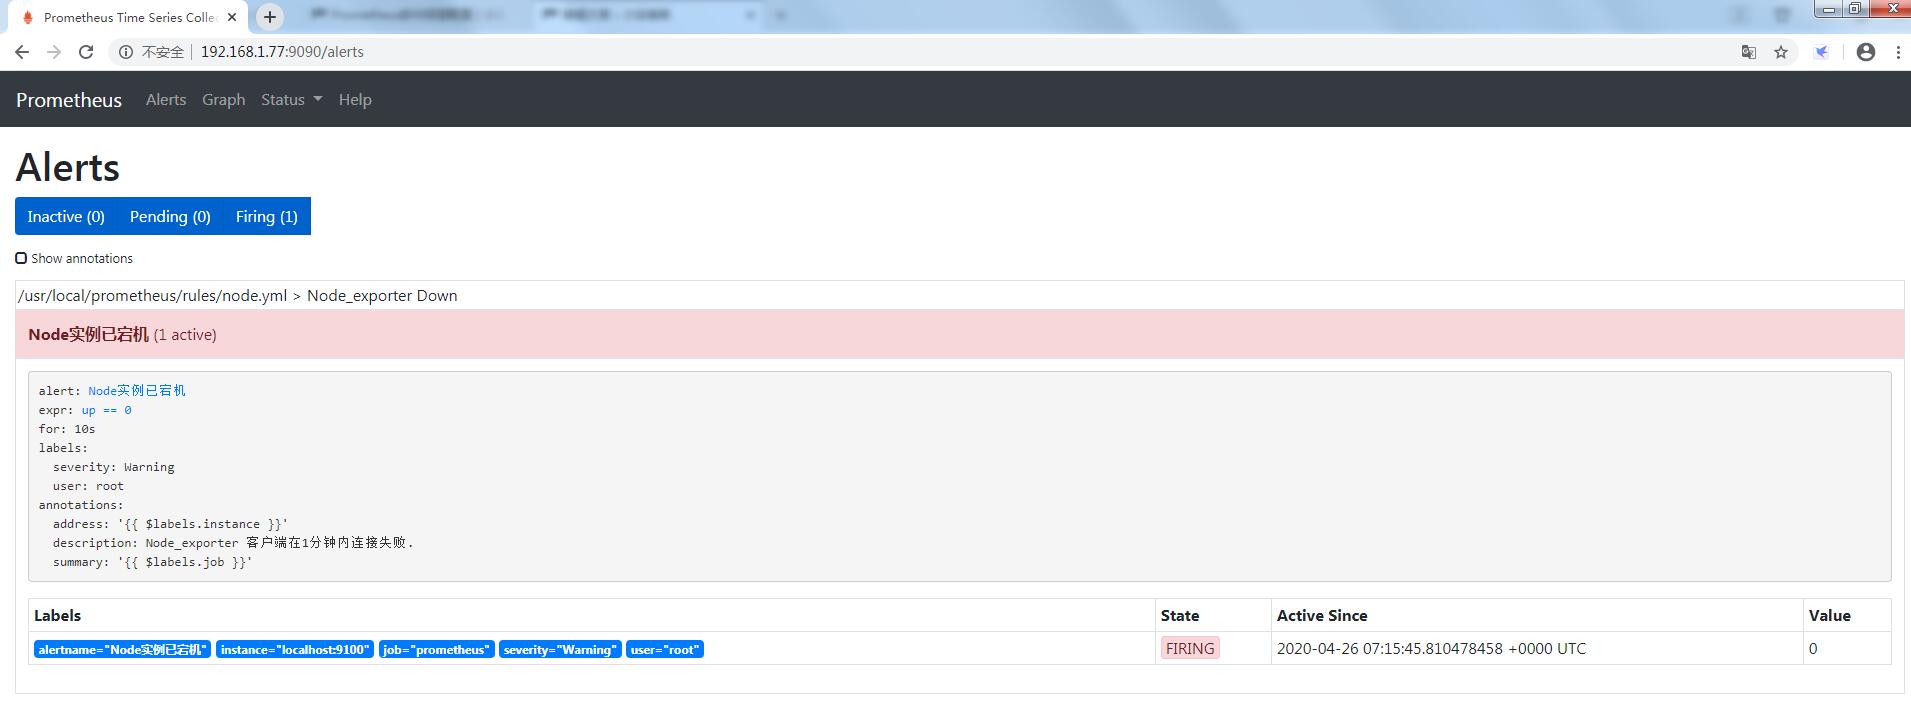
- 10秒后状态由PENDING变为FIRING,此时Prometheus才将告警发给alertmanager,在Alertmanager中可以看到有一个alert。
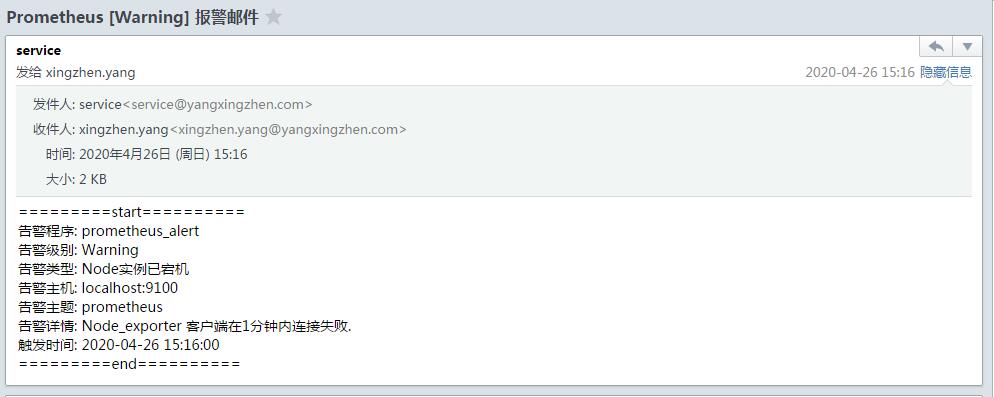
10、邮箱会收到告警邮件
11、再次启动node_export
[root@localhost ~]# systemctl start node_exporter
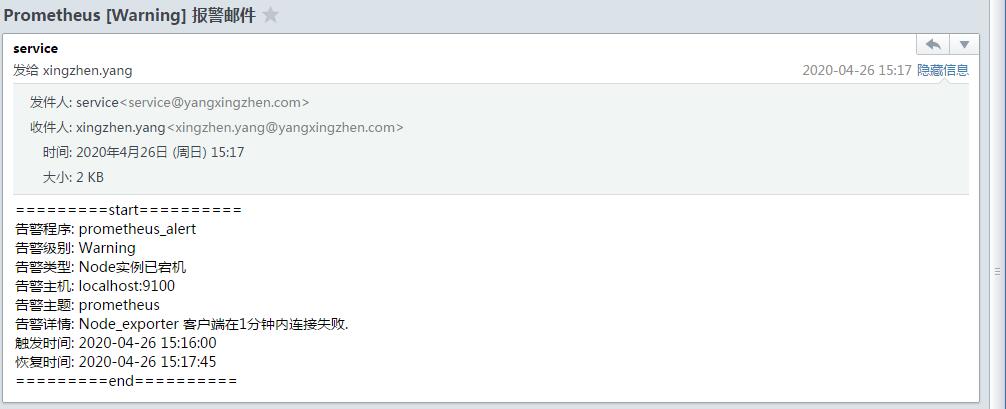
邮箱会收到恢复信息
附:
CPU使用率告警规则:
groups:
- name: CPU
  rules:
  - alert: CPU使用率过高
    expr: (100 - (avg by (instance) (irate(node_cpu{mode="idle"}[5m])) * 100)) > 80
    for: 1m
    labels:
    severity: Warning
      annotations:
    summary: "{{ $labels.instance }} CPU使用率过高"
      description: "{{ $labels.instance }}: CPU使用率超过80%,当前使用率({{ $value }})."
内存使用率告警规则:
groups:
- name: Memory
  rules:
  - alert: 内存使用率过高
    expr: (node_memory_MemTotal - (node_memory_MemFree+node_memory_Buffers+node_memory_Cached )) / node_memory_MemTotal * 100 > 80
    for: 1m  #告警持续时间,超过这个时间才会发送给alertmanager
    labels:
      severity: Warning
    annotations:
      summary: "{{ $labels.instance }} 内存使用率过高"
      description: "{{ $labels.instance }}:内存使用率超过80%,当前使用率({{ $value }})."
若文章图片、下载链接等信息出错,请在评论区留言反馈,博主将第一时间更新!如本文“对您有用”,欢迎随意打赏,谢谢!


评论